On this page
User Manual
This is the complete guide to using PatchManager once it's installed and you're logged in. For provisioning, installing, upgrading, or licensing the server itself, see the Documentation page instead — this manual picks up right after your first login, on the main Dashboard.
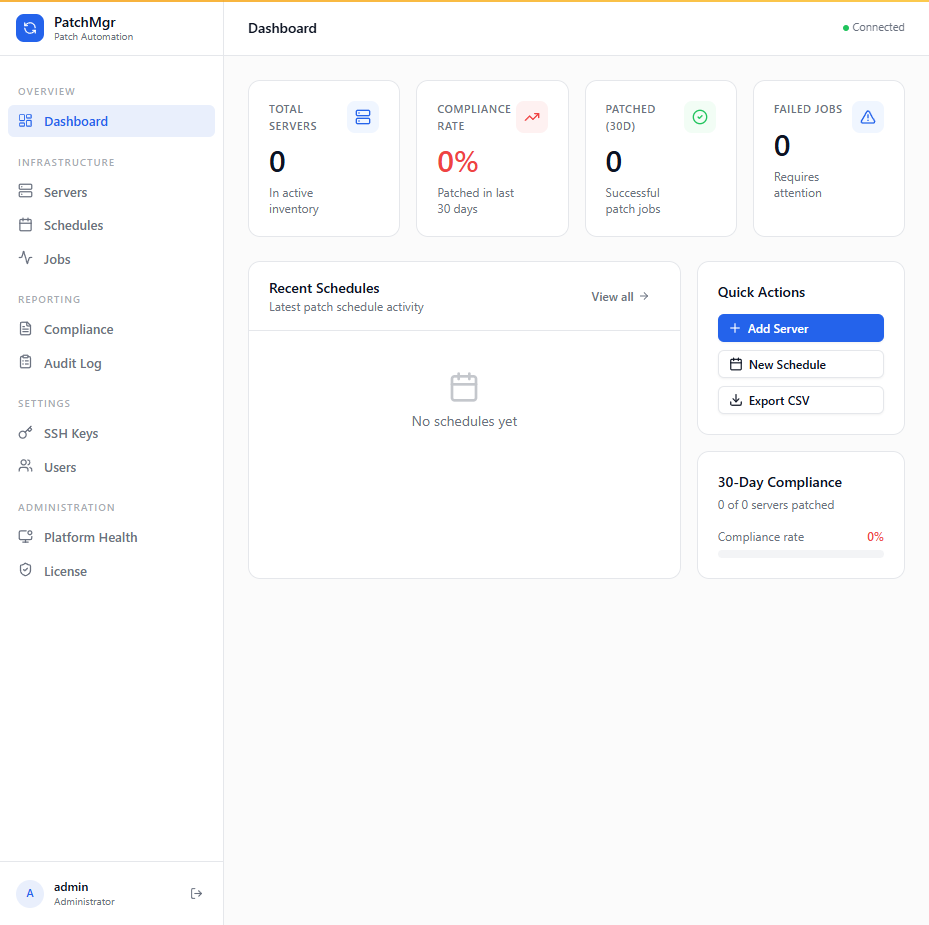
Dashboard
The landing page after login. Shows summary stat cards for your environment, the 5 most recently created patch schedules, and the 5 most recently added servers. Use it as a starting point to jump into any recent activity — it's a summary view, not where you take action.
Adding & Managing Servers
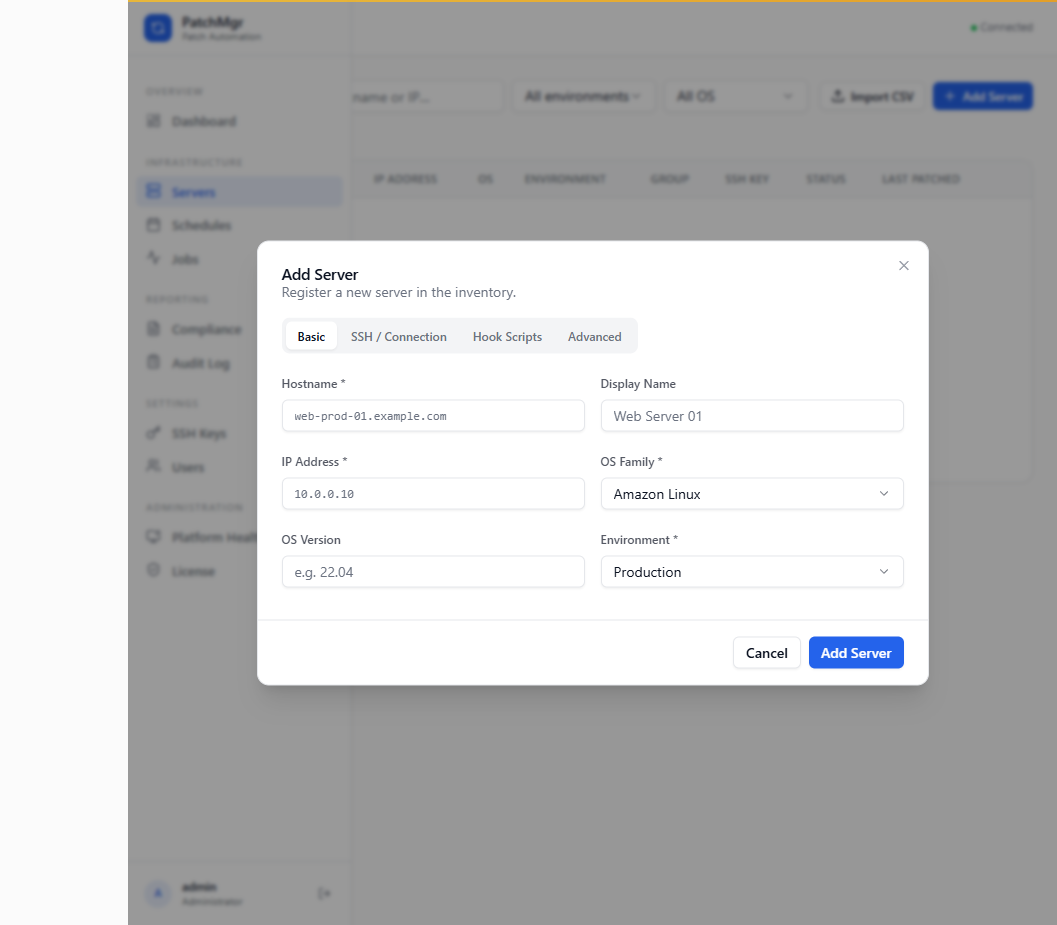
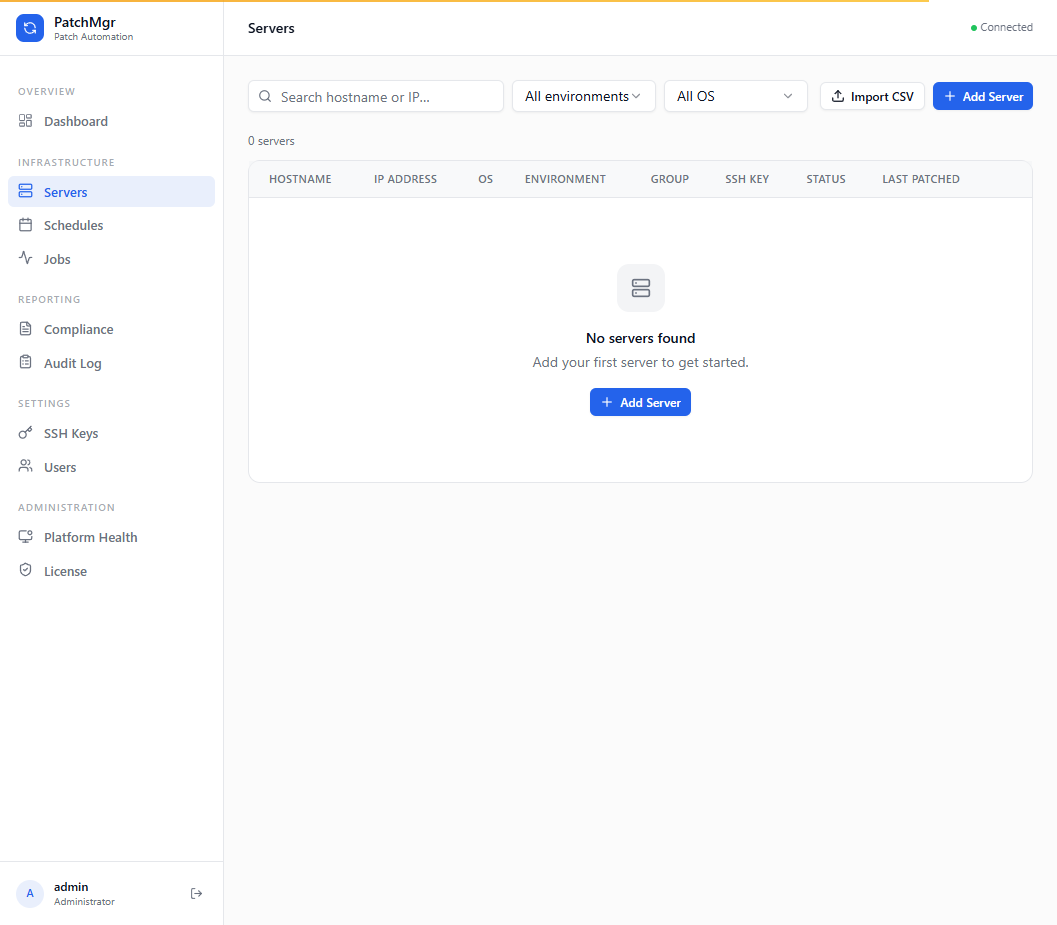
Go to Servers in the main navigation, then Add Server. The form has four tabs:
- Basic — Hostname* and IP Address* (required), Display Name, OS Family* (Amazon Linux, RHEL, Debian, SUSE, Windows), OS Version, Environment* (Production, Staging, Development, DR).
- SSH / Connection — SSH User, SSH Port, and an SSH Key (either the platform default key or a named key you've added under SSH Keys).
- Hook Scripts — optional pre-patch and post-patch shell scripts that run on the target server, each with its own enable toggle and a timeout (30–86400 seconds, default 300).
- Advanced — free-text notes.
Bulk import via CSV/Excel
Click Download Template to get the correct column format, fill it in, then upload a
.csv or .xlsx file. Each row can optionally include a schedule date — those
servers still go through the normal approval workflow, they're just pre-populated into a schedule.
Import errors are reported per row, so a bad row doesn't block the rest of the file.
Actions on an existing server
Available from the ⋯ menu on each server row (some require an admin role):
- Edit — update any field from the Add Server form.
- Test Connection — runs a live SSH connectivity check and reports success/failure immediately.
- Patch Now (admin only) — patches the server immediately, with no approval step and no scheduled window. Choose a Patch Type (Security only / All updates) and Reboot Policy (If required / Always / Never) before confirming.
- Configure Hooks — a focused entry point for editing pre-/post-patch scripts. App Owners and DBAs can use this without needing full admin access, even though they can't edit the rest of the server record.
- Deactivate — soft-deletes the server. It stops appearing in new schedules, but its patch history is preserved.
Scheduling Patches
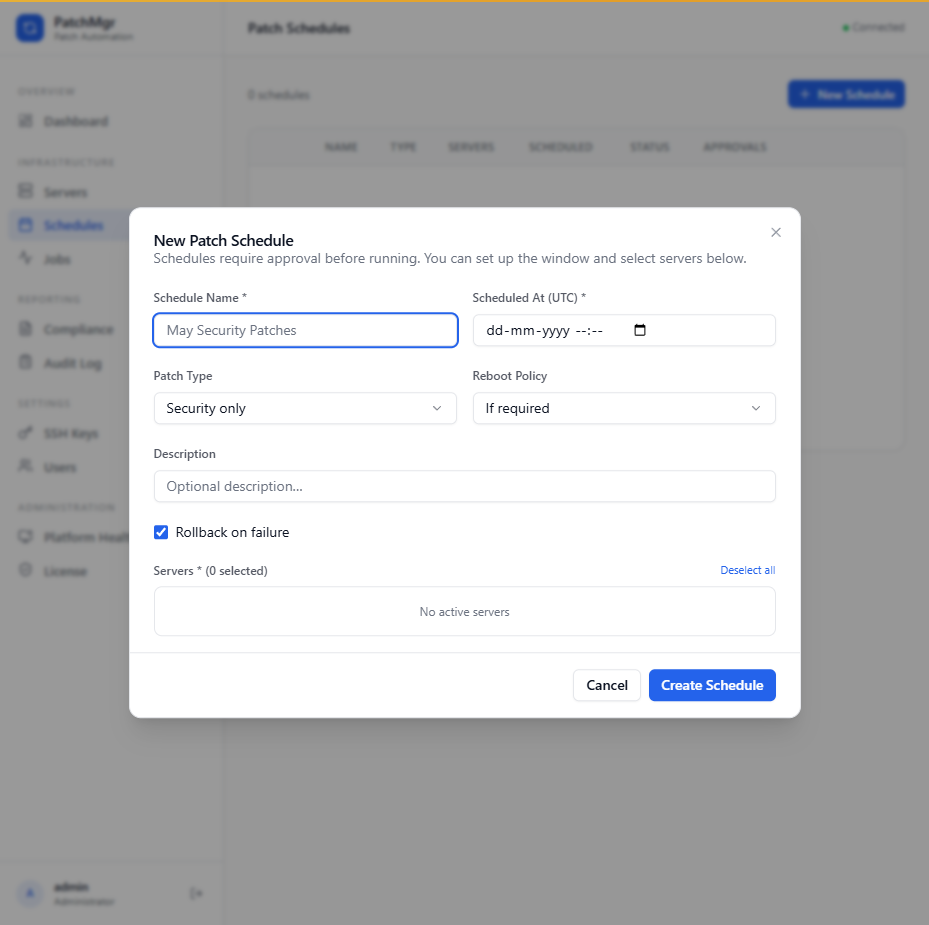
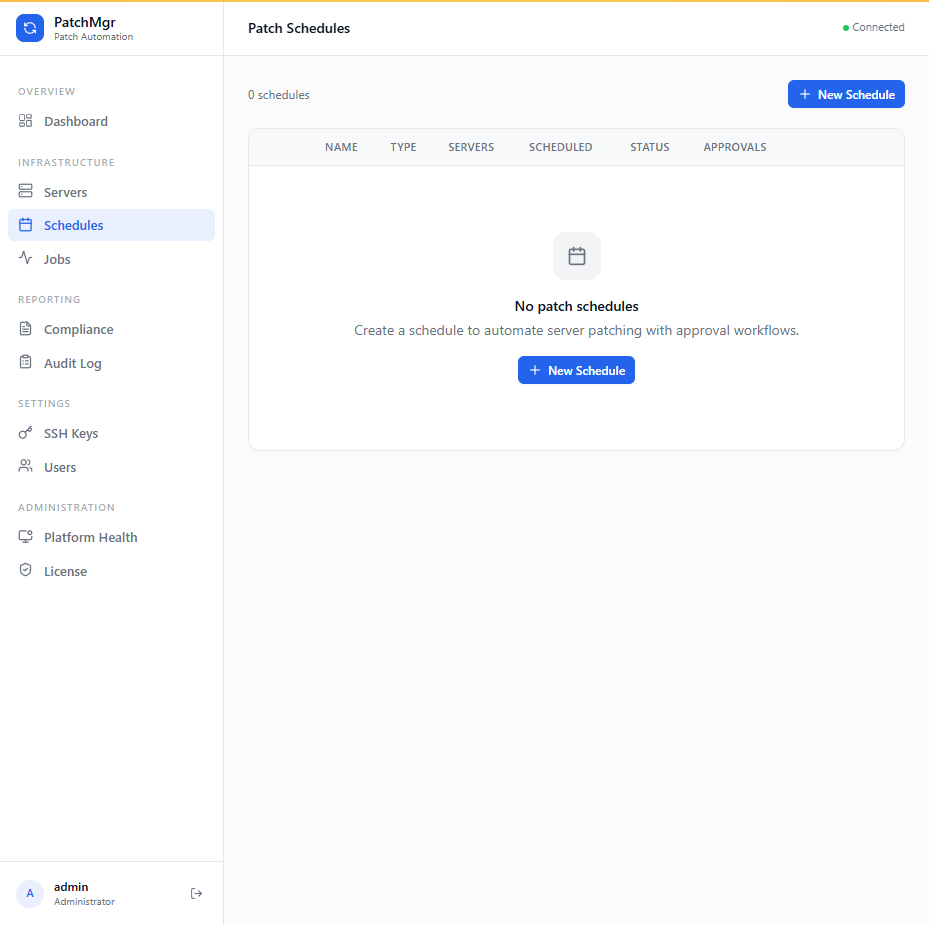
Go to Patch Schedules → New Schedule and fill in:
- Schedule Name and an optional Description
- Scheduled At — stored and displayed in UTC
- Patch Type — Security only, All updates, or Custom
- Reboot Policy
- Rollback on failure — an optional checkbox
- A multi-select server picker, with Select all / Deselect all shortcuts
Approval workflow
Every new schedule starts as pending approval. Only an Admin or OS Admin can approve it. Once approved, it either dispatches automatically at its scheduled time or can be triggered immediately with Run Now. A pending or approved schedule can still be Cancelled. Schedules that have reached a terminal state (completed, failed, cancelled, or rejected) can be archived individually or in bulk with Clear / Clear Selected.
Watching a schedule run
Expand any schedule to see two tabs:
- Jobs — the per-server job list, each with live status, the patches involved, duration, and a log viewer.
- Check Results — an aggregate table of pre-check, post-check, and remediation results across every server in the schedule.
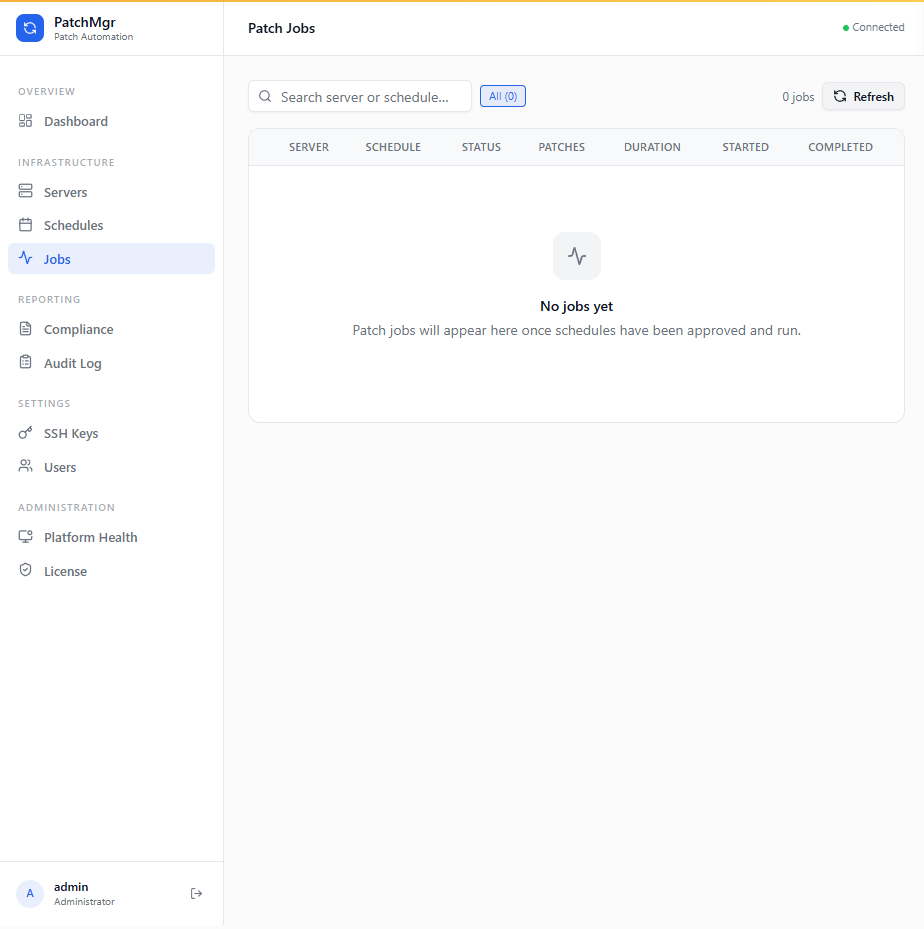
Patch Jobs
The Patch Jobs page is a flat, filterable view of every job across every schedule — useful when you want to find one server's history without digging through individual schedules.
Every job moves through the same lifecycle, shown as a progress bar and stage timeline:
Queued → Pre-Hook → Pre-Check → Remediation → Patching → Pre-Reboot → Reboot → Post-Check → Post-Hook
Click into a job for four tabs of detail:
- Progress — the live stage timeline
- Pre/Post Checks — disk free space, package lock status, service health, and the list of packages that were updated
- Hooks — stdout and duration for the pre- and post-patch scripts
- A raw Ansible log, viewable in full
A failed or rolled-back job can be Retried, up to 3 attempts.
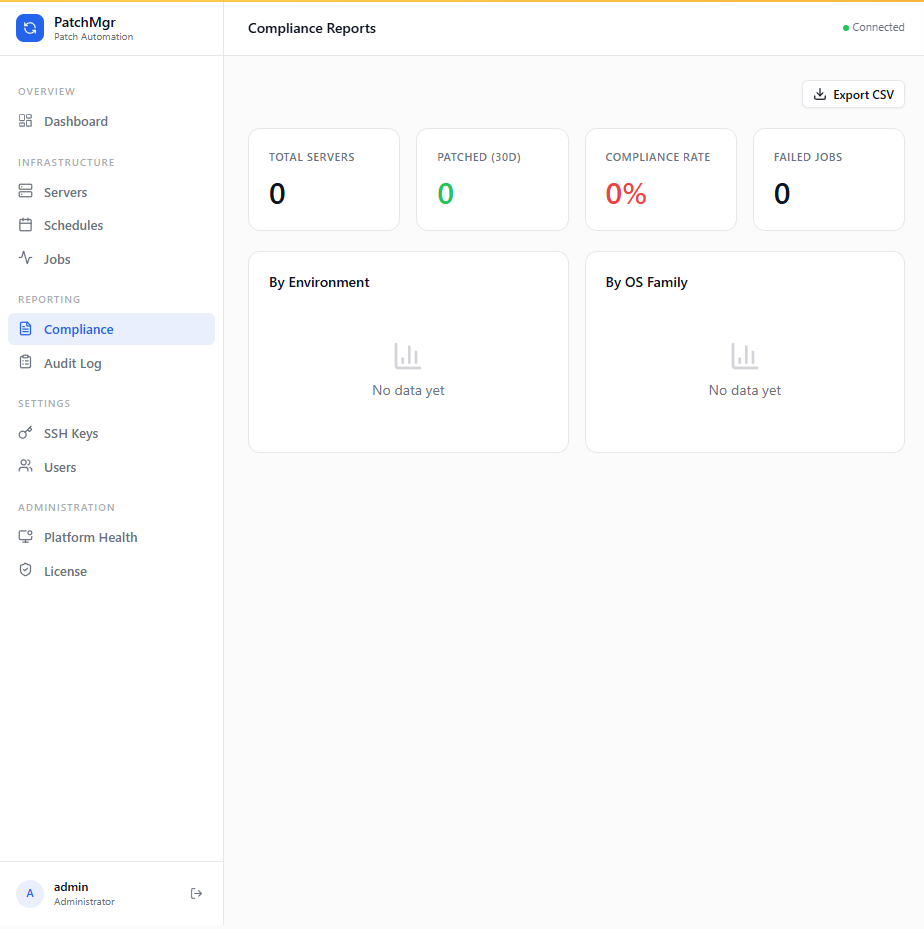
Compliance Reports
Shows compliance-rate bars across your fleet and supports CSV export for sharing with auditors or management outside the tool.
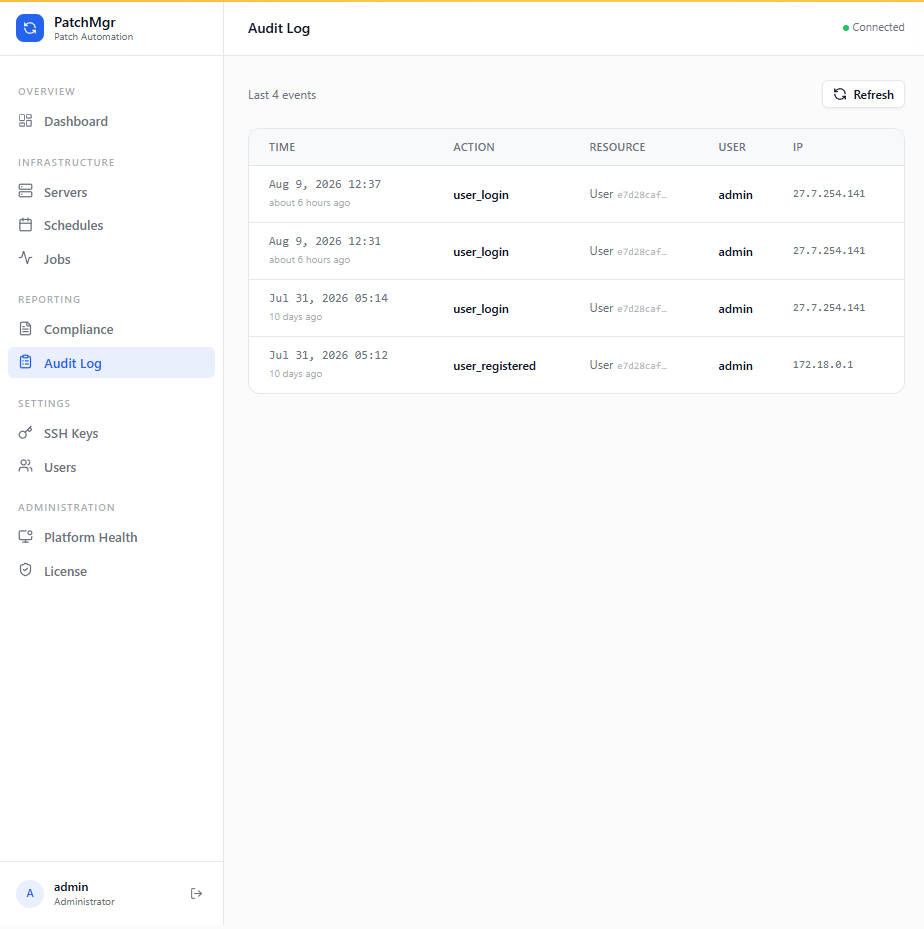
Audit Log
A read-only table of the last 100 audit events — who did what, and when. Not filterable or exportable; it's a quick recent-activity view, not a compliance report.
SSH Keys
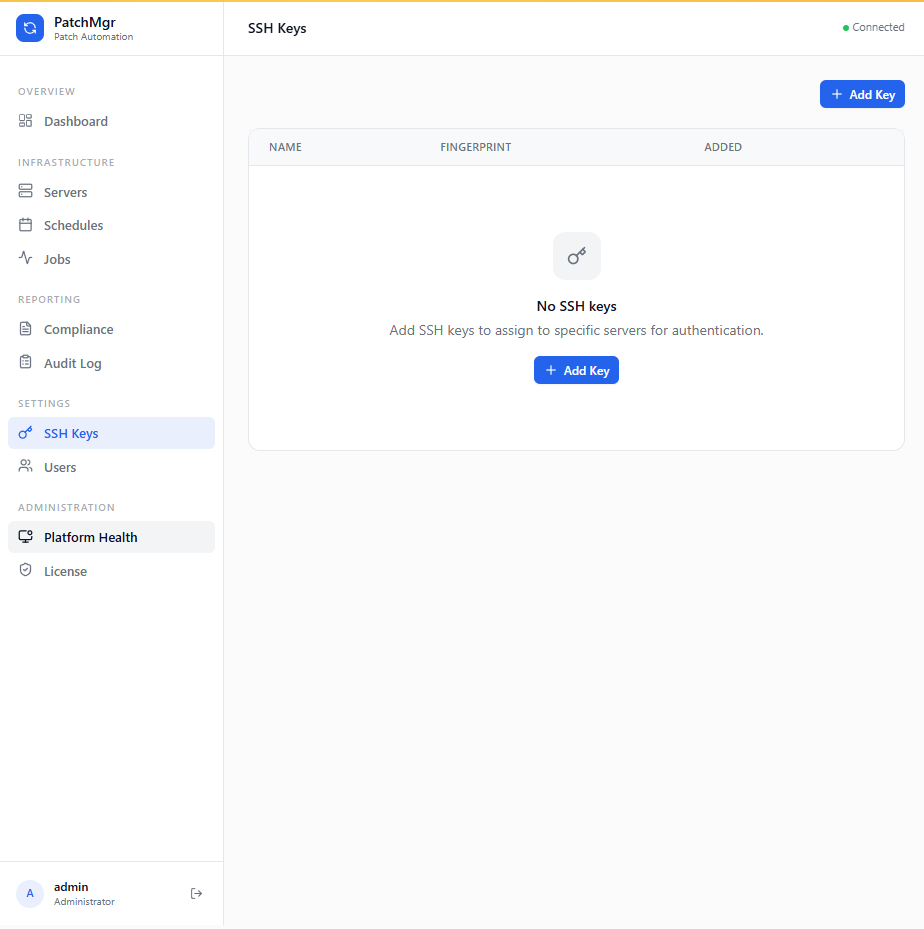
Generate a new key pair in-app, import an existing private key, delete keys you no longer use, and set one key as the platform default so new servers don't each need their own key selected manually.
Users & Roles
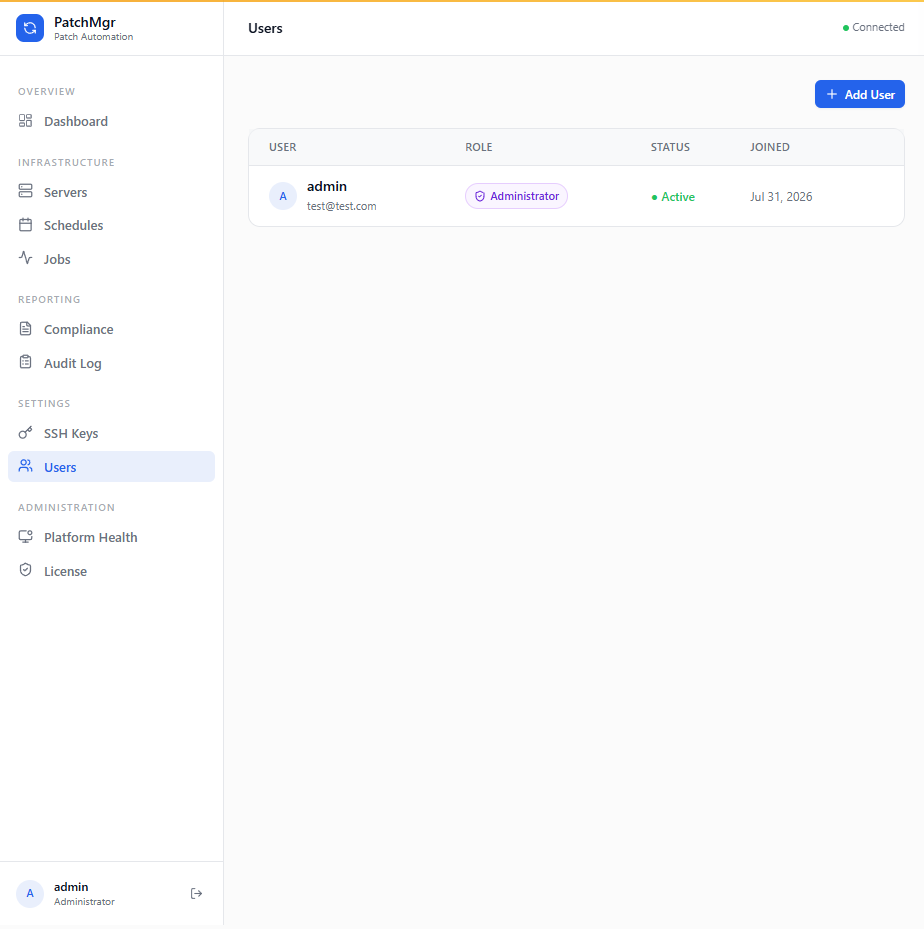
Only an Admin can invite new users. The invite dialog only offers the App Owner and DBA roles — Admin and OS Admin accounts can't be created from the UI. Admins can also deactivate, reactivate, or delete a user.
| Role | Can do |
|---|---|
| Admin | Everything — manage users, manage servers, run Patch Now, approve schedules, manage SSH keys, activate license, view Platform Health |
| OS Admin | Full server management, schedule approvals, and Platform Health — cannot manage users, SSH keys, or the license |
| App Owner | View servers and jobs, configure hook scripts on assigned servers |
| DBA | Same as App Owner, scoped to database servers |
| Viewer | Read-only — view servers, jobs, and compliance reports |
License & Trial
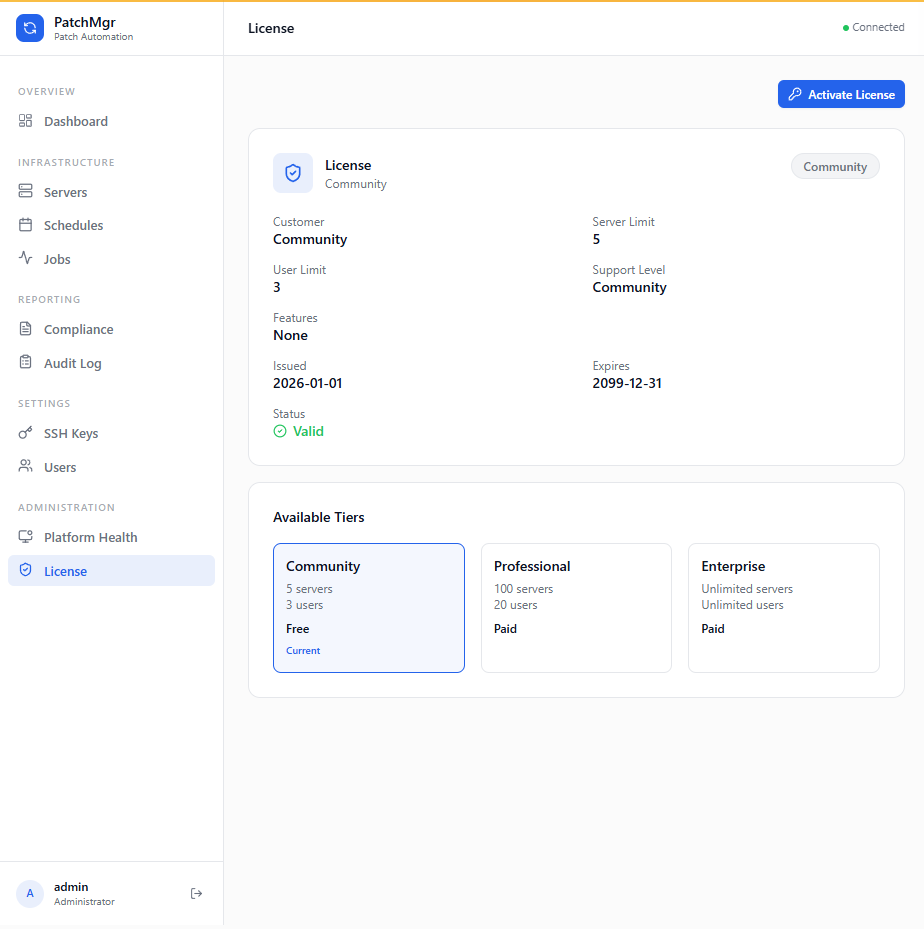
PatchManager starts in the free Community tier — up to 5 servers and 3 users, no
license key required. To activate Professional (100 servers / 20 users) or
Enterprise (unlimited), go to License in the admin section, paste
the PMGR-... key you received by email into Activate License, and
confirm. It takes effect immediately — no restart needed.
The License page shows your customer name, email, server and user limits, support level, enabled features, and issue/expiry dates. It warns you once your license has 30 days or fewer remaining.
Platform Health
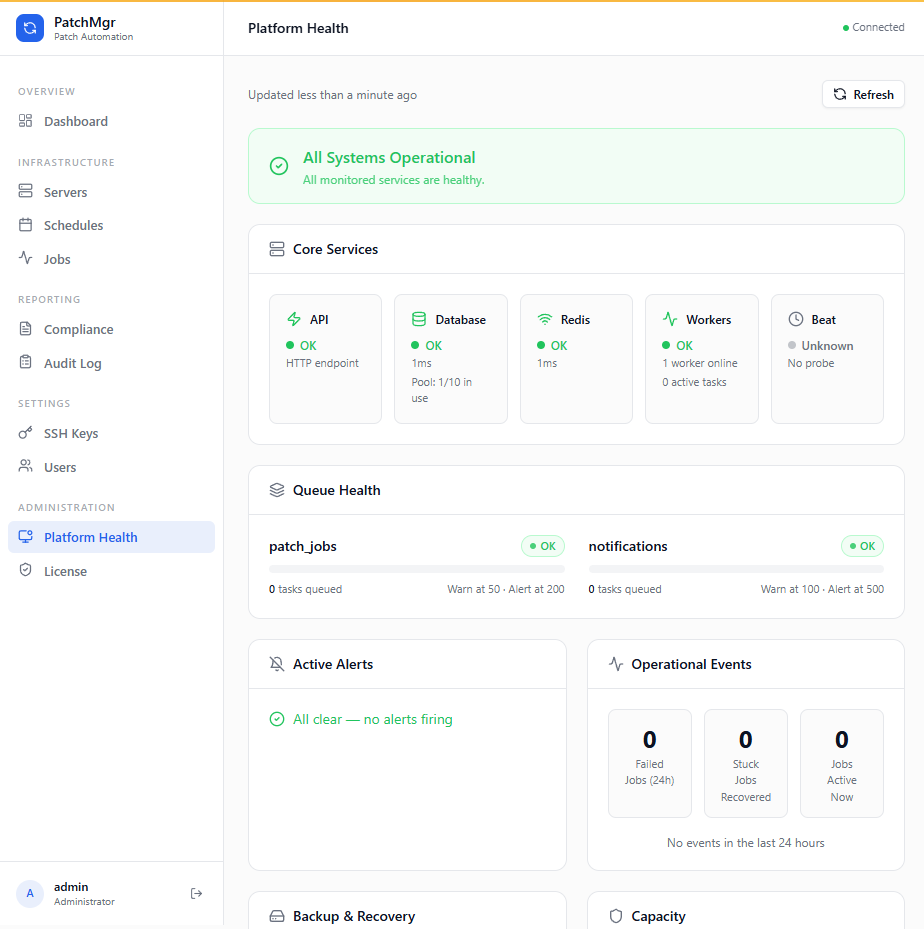
An operations dashboard for the PatchManager platform itself — not your managed servers' patch compliance. Available to Admins and OS Admins. It shows:
- An overall status banner (OK / Degraded / Critical)
- Core service health — API, database, Redis, workers, and the scheduler, with response times, connection pool usage, and worker/task counts
- Queue depth against warning/alert thresholds
- Active alerts, if Alertmanager is configured
- A feed of recent operational events — failed jobs and automatic stuck-job recoveries in the last 24 hours
- Age of the most recent backup
- Capacity — license tier usage bars for servers/users, plus a separate sizing advisory unrelated to your license limits
The page auto-refreshes every 30 seconds (paused while the tab isn't active). If Grafana is configured, an Open Advanced Diagnostics link is available for deeper drill-down.
Need help? Email support@patchmanager.co.in or open an issue on GitHub.